
A Comparative Methodological Review of Operational-Maturity and Organizational-Assessment Instruments for Businesses, Nonprofits, and Local Government
1. Scope, method, and disclosure of interest
Conflict-of-interest disclosure. This document is authored by Over50Pros, the organization that produces the OQ Score. That is a material interest, and a reader should weigh the assessment of the OQ Score accordingly. To preserve usefulness as a citable reference, the instrument is described using its own published limitations, the comparators are described from independent and primary sources and claims that favor any instrument, including this one, are flagged where they rest on vendor-reported rather than independently validated evidence.
Method. Seven instruments were selected to span the relevant sectors and the major instrument families: the OQ Score; CMMI; the Baldrige Excellence Framework; the EOS Organizational Checkup; the Value Builder Score; the Core Capacity Assessment Tool (CCAT); and ISO 18091/9001. Each was characterized on a consistent set of attributes, domain, segment, structure, scoring and anchoring method, respondent design, benchmarking, validation status, and output. Facts about comparators are drawn from primary sources (standards bodies, program owners, peer-reviewed and practitioner literature) cited by number and listed in the References. Methodological claims about scoring techniques are grounded in the measurement-science literature rather than in any vendor’s materials.
What this review does not do. It does not rank instruments by a single figure of merit; the instruments answer different questions for different decision-makers. It does not certify any instrument’s validity; validity is an empirical property that must be demonstrated, not asserted. And it does not treat commercial scale (number of administrations sold) as evidence of measurement quality.
With a structured evaluation of the OQ Score (Operating Quotient) and the Business Operating Intelligence (BOI) System
Over50Pros · Strategic Operations Advisory
Author: Sherman Mohr, BOI System Methodology & Delivery
Version 1.0 · June 2026
Intended use: a reference resource for advisors, lenders, funders, board members, and public administrators evaluating diagnostic instruments. Written to be read, quoted, and cited as an academic comparison — not as marketing.
2. The measurement problem
“How well does this organization run?” is a deceptively hard question to measure. The underlying construct, operational maturity, is multidimensional, partly tacit, and observed almost entirely through the eyes of the people being measured. Three problems recur across every instrument in this review.
- Self-report bias. When the same person reports both the state of the business and, implicitly, their own competence, responses are systematically distorted. This is the well-documented problem of common method bias, whose sources include a respondent’s limited insight, acquiescence (“yea-saying”), and low engagement that produces uniform answering. [13]
- Ordinality. Maturity levels are ordered categories, not equal-interval measures: the distance from “reactive” to “standardized” is not guaranteed to equal the distance from “integrated” to “closed-loop.” Averaging such levels into decimals is common and useful but implies more precision than the scale strictly possesses. [12]
- Validity. Face validity (the items look right) is the easy part. Demonstrated predictive validity, that the score forecasts an outcome a decision-maker cares about, is rare, expensive, and the property that separates a credible standard from a well-designed worksheet.
Every instrument here is, in part, a set of design choices for managing these three problems. The choices are what the next section evaluates.
3. The methodological building blocks
3.1 Behavioral anchoring (BARS)
The strongest design choice available to a self-report instrument is to replace abstract rating points with described behavioral states, a Behaviorally Anchored Rating Scale, introduced by Smith and Kendall in 1963. Instead of asking a respondent to rate operations “4 out of 5,” an anchored item asks them to select the sentence that matches what actually happens. The measurement literature finds that anchored scales tend to reduce halo effect, leniency, and central-tendency error relative to ordinary Likert scales and tend to improve agreement between independent raters. The literature is honest in that the advantage appears sometimes rather than always, and that the magnitude of improvement is often modest. [11] The cost of anchoring is development effort: each item must be written as a behavioral continuum, which is slow and expensive compared with a generic rating scale. [11]
3.2 Maturity levels and the CMM lineage
The five-level progression from reactive to optimizing descends directly from the Capability Maturity Model developed at Carnegie Mellon’s Software Engineering Institute, first published in 1991 and itself inspired by Philip Crosby’s quality-maturity grid. [2] The pattern — ad hoc → repeatable/managed → defined/standardized → quantitatively managed/integrated → optimizing/closed-loop — has proven durable across domains because it tracks the real path organizations travel from heroics-and-memory to explicit, self-improving systems. [1] It also inherits the well-known academic critiques of maturity models: questions about construct completeness, the subjectivity of self-assessment, and reliance on a single respondent. [12]
3.3 Consistency and careless-response checks
Reverse-coded items — questions phrased so that strong agreement indicates low maturity — are a standard device for catching respondents who pattern-match to the answer an instrument seems to want. They are useful but contested: the methodological literature shows that negatively worded items can themselves introduce artifacts, confusing some respondents and depressing scale reliability, so a triggered flag is genuinely ambiguous between inflation and simple misreading. [14] A complementary and less artifact-prone check is straight-lining detection, flagging a respondent whose answers within a section show near-zero variance, a recognized signature of low-engagement responding. [13]
3.4 Single- versus multi-rater administration
The single most effective mitigation for self-report bias is to collect independent ratings from several leaders and treat disagreement as diagnostic. Where leaders disagree about maturity is often where a shared blind spot lives. Instruments differ sharply here: CCAT and the EOS Checkup expect multiple raters; the Value Builder Score is typically completed by the owner alone; CMMI and Baldrige sidestep the problem by using trained external appraisers rather than self-report. [7] [9]
3.5 Norm-referencing and predictive validity
A raw score answers “what state am I in?” A norm-referenced score answers the more useful question “how do I compare to organizations like me?” This requires a benchmark dataset. Predictive validity goes further still, linking the score to a realized outcome. Among the instruments reviewed, the Value Builder Score makes the strongest predictive claim (relating high scores to higher acquisition offers), and CCAT is explicitly described as statistically validated with a national benchmark, though in both cases the supporting data is largely held by the instrument’s owner rather than independently replicated. [8] [9]
4. Comparison grid
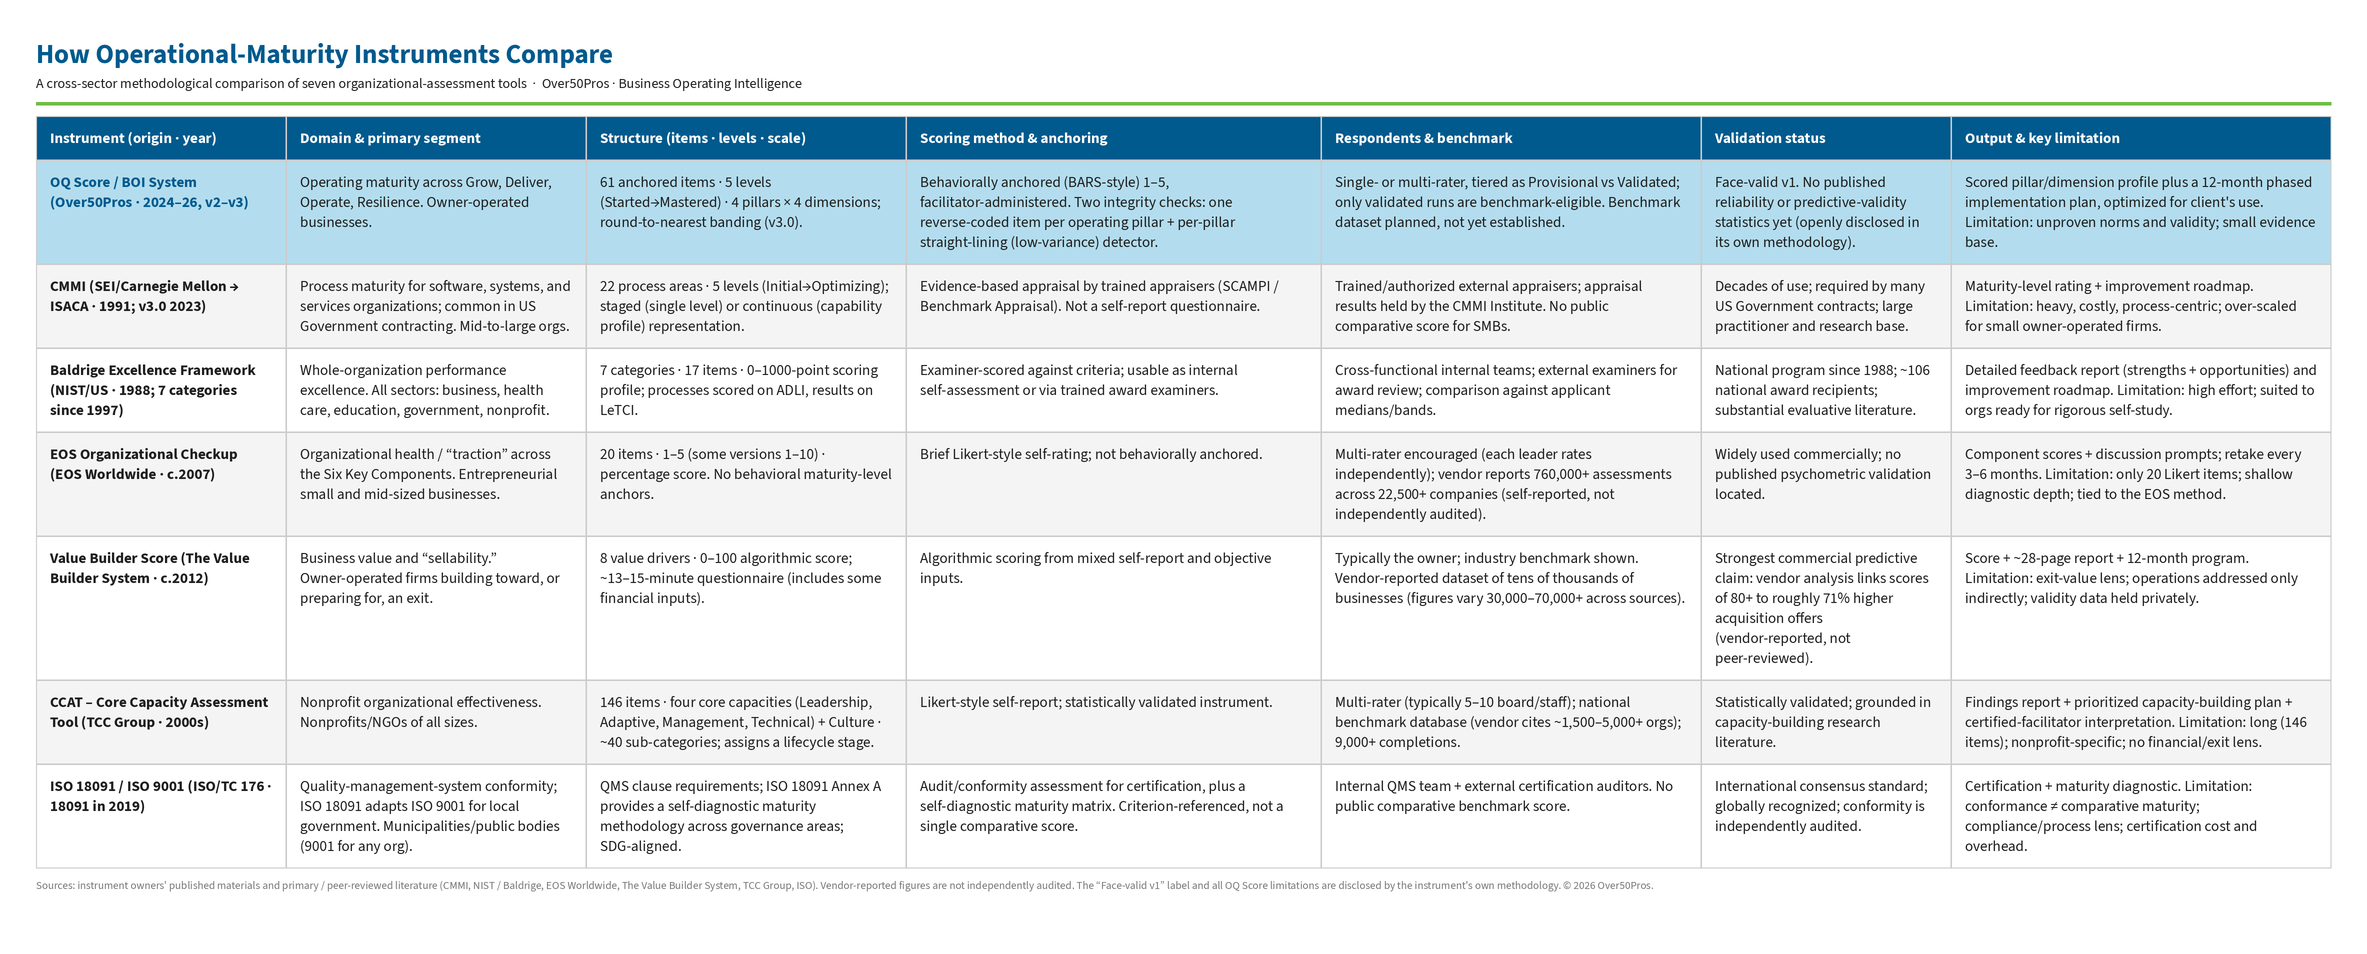
The grid below summarizes the seven instruments on a common set of attributes. The OQ Score row is shaded for navigation, not to denote superiority. “Vendor-reported” marks figures supplied by an instrument’s owner that this review could not independently verify.
5. The OQ Score assessed, level by level
The OQ Score reports a 1–5 composite, mapped to five maturity bands. Under its current (v3.0) banding the composite is mapped to the nearest described state — Started (1.00–1.49), Managed (1.50–2.49), Refined (2.50–3.49), Integrated (3.50–4.49), Mastered (4.50–5.00) — which corrects an earlier design in which only a literal, near-unreachable perfect score could register as the top level. Each level is a qualitative state, not an arbitrary cutpoint:
- Started (≈1): capability is reactive; activity happens when prompted by crisis. Equivalent in spirit to CMMI Level 1 (Initial).
- Managed (≈2): foundational structures exist but are inconsistent; outcomes depend on specific individuals.
- Refined (≈3): standardized procedures and tools are in place and followed most of the time. This is where most firms in the target band sit, and where the literature locates the greatest available leverage.
- Integrated (≈4): systems and data integrate across functions; decisions are data-informed.
- Mastered (≈5): closed-loop — observations trigger documented changes whose outcomes are measured and fed back. Equivalent to CMMI Level 5 (Optimizing).
Assessed as a measurement design, the level structure is sound and its lineage is credible. Two features distinguish it from the typical maturity model. First, it adds a Resilience pillar — owner-dependency, customer concentration, cash discipline, bench depth, decision velocity, and continuity — that conventional process-maturity models omit, and that is precisely the dimension exit-planning advisors and lenders care most about. Second, it pairs two independent integrity checks (reverse-coded items and straight-lining detection) and tiers its output as Provisional (single-rater) or Validated (multi-rater, reconciled), admitting only validated results to any future benchmark.
6. Comparative analysis
6.1 Where the OQ Score is comparatively strong
- Anchoring depth for its segment. Among instruments aimed at owner-operated firms, the OQ Score’s full behavioral anchoring is closer to CMMI/Baldrige rigor than to the brief Likert format of the EOS Checkup, while remaining administrable in a single facilitated session. [7] [11]
- Dual integrity checks. Pairing reverse-coded items with a straight-lining detector is more robust than relying on either alone, and more than most commercial SMB tools attempt. [13] [14]
- Resilience coverage. The explicit fragility pillar fills a gap left by process-centric models (CMMI) and value-centric ones (Value Builder), and speaks directly to the lender, funder, and exit-advisor audience.
- Action coupling. Like CCAT’s capacity-building plan and Baldrige’s feedback report, the OQ Score’s deliverable is a sequenced twelve-month plan, not a bare number, the feature most associated with assessments that actually change behavior. [9] [5]
6.2 Where the OQ Score is comparatively weak
- No published reliability statistics. CCAT is described as statistically validated; the OQ Score has not yet published internal-consistency, inter-rater, or test-retest figures. This is the largest single gap and the easiest for a numerate evaluator to probe. [9]
- No demonstrated predictive validity. The Value Builder Score, whatever the limits of vendor-held data, can point to an outcome relationship; the OQ Score currently rests on face validity and an explicit acknowledgment that it has not been validated against external performance measures. [8]
- No mature benchmark. CMMI, Baldrige, CCAT, EOS, and Value Builder all draw on accumulated datasets; the OQ Score’s benchmark is planned, so its scores are presently criterion-referenced (against the anchors) rather than norm-referenced (against peers).
- Single-rater default in practice. Although the instrument tiers Provisional vs Validated, a sole-facilitator delivery model makes single-rater administration the common case, the same vulnerability flagged for the Value Builder Score.
The honest summary: the OQ Score is a thoughtfully designed v1 instrument whose distinctive choices (anchored maturity + dual integrity checks + a resilience pillar + an integrated plan + a validity-tiering mechanism) are genuine, and whose principal gaps (reliability evidence, predictive validity, a working benchmark) are real and are shared by most of its commercial peers. On demonstrated validation it currently trails CCAT and the Value Builder Score; on design breadth for its specific segment, it compares well.
7. Why this design is uniquely useful to an organization that cannot see its own blind spots
An organization that does not know what it does not know cannot diagnose itself with open-ended questions, because it has no frame of reference for its own gaps. Anchored maturity items supply that frame. The blind spot is revealed in the gap between where leadership assumes it sits and the described reality of the next level up. Reading a Level 4 anchor, “systems exchange data without manual re-entry”, and recognizing “we re-key every invoice by hand” is the moment of discovery; the instrument does not ask the respondent to perceive the gap, it shows the gap and lets recognition do the work. Three features compound this effect for the unaware organization specifically:
- It attacks the most dangerous class of blind spot, the confident one. People investigate least where they feel most competent. A reverse-coded item is engineered to fire exactly there; the straight-lining check catches the uniform, unreflective response pattern that masks it.
- It converts vague unease into a named, addressable gap. “Something feels fragile” becomes “cash is reviewed only when it feels tight, a specific item at the bottom of the scale,” which is a thirty-day fix rather than a feeling.
- It protects against the second-order error. The unaware organization’s failure is not only missing a gap but optimizing the wrong thing first. A risk-first sequencing discipline, stabilize fragile foundations before tuning strong areas, prevents polishing a strength while an unseen exposure compounds.
8. Benchmarking and AI: from descriptive to predictive
A maturity score’s usefulness rises in three stages, and an AI-assisted benchmark layer is what moves an instrument up the ladder.
- Stage 1 — descriptive (today). The anchors tell an organization which described state it occupies. Useful, but it cannot say whether that state is good or bad for an organization of its kind.
- Stage 2 — norm-referenced. With a benchmark of comparable organizations, a raw score becomes a position: “your delivery systems are bottom-quartile for firms of your size and sector.” This is the step that gives a score comparative meaning, the same step that makes a credit score informative. An AI layer’s role here is pattern detection across many scored organizations: identifying recurring maturity archetypes and the sub-score combinations that cluster together.
- Stage 3 — predictive. With benchmark scores linked to realized outcomes (an exit, surviving the loss of a major customer, scaling past a revenue ceiling), analysis can begin to associate patterns of maturity with results and recommendations can shift from expert judgment toward evidence-weighted guidance: “organizations resembling yours that closed this specific gap saw this change.” This is the level the Value Builder Score claims for exit value; it is the level a benchmarked OQ Score would aspire to for operational outcomes. [8]
How this anchors a twelve-month plan. A benchmark plus an AI layer makes a plan better in three concrete ways. It prioritizes by flagging the gaps that are both low for the organization and low relative to peers, rather than merely low in absolute terms. It sequences using the orderings that produced the largest gains for similar organizations, upgrading risk-first heuristics with evidence. And it personalizes at scale, drafting the bulk of a sequenced plan, initiative selection, cost bands, and success criteria from the scored profile and benchmark, leaving the high-judgment work to a human facilitator. That last point also relieves the binding constraint on any single-facilitator delivery model.
The integrity caveat is not optional. An AI layer is only as good as the benchmark beneath it, and four risks are decisive. A cold-start dataset cannot support published percentile claims; releasing them prematurely is the fastest way for a sophisticated evaluator to discredit the instrument. If the benchmark is built from inflated single-rater self-reports, the model learns and amplifies the bias, which is why the reverse-coded, straight-lining, and Validated-tier safeguards are the same problem as AI quality, not a separate one. Generative models over-claim by default, so every recommendation must carry a calibrated confidence and an explicit n of comparable cases. And organizations that complete a facilitated assessment and consent to benchmarking are not a random sample, so norms will skew optimistic and that selection effect should be disclosed.
9. Limitations of this review
- Instrument facts current to mid-2026 may change as owners revise their tools; figures attributed to instrument owners are vendor-reported and were not independently audited.
- Seven instruments cannot represent an entire field; single-construct instruments (for example, employee-engagement or customer-loyalty measures) and broader frameworks (the Balanced Scorecard, EFQM) are referenced only in passing.
- The author has a direct interest in one instrument reviewed; see the Section 1 disclosure.
10. Conclusion
No instrument in this review is best in general, because they answer different questions. CMMI and Baldrige bring appraiser-led rigor at a weight most small organizations cannot carry. The EOS Checkup is fast and culturally embedded but diagnostically thin. The Value Builder Score has the strongest outcome claim but views the organization solely through exit value. CCAT is the most validated of the self-report tools but is nonprofit-specific. ISO 18091 brings audited international consensus but measures conformance, not comparative maturity. Against this field, the OQ Score’s contribution is a coherent design for a segment the rigorous instruments overserve and the fast instruments underserve: behaviorally anchored maturity, an explicit resilience dimension, paired integrity checks, validity tiering, and an action plan as the deliverable. Its task now is the unglamorous one that separates a measurement from an opinion, publish reliability statistics, capture outcomes, and build the benchmark, before the language of a “standard” is fully earned.
For all evidence based research and academic papers, visit this link for updates. https://boisusa.com/category/inside-the-oq-score/
References
[1] Capability Maturity Model Integration — overview, five levels, v3.0 (2023), ISACA/CMU. https://en.wikipedia.org/wiki/Capability_Maturity_Model_Integration
[2] CMMI background: 1987 origin, Crosby/Deming lineage, 22 process areas, staged vs continuous representations (Microsoft Learn). https://learn.microsoft.com/en-us/azure/devops/boards/work-items/guidance/cmmi/guidance-background-to-cmmi
[3] About the Baldrige Excellence Framework — seven categories (NIST). https://www.nist.gov/baldrige/about-baldrige-excellence-framework
[4] Hill, J. B. An empirical evaluation of the Baldrige Performance Excellence Program framework — 1988 origin; seven categories; 1000 points. https://louis.uah.edu/cgi/viewcontent.cgi?article=1356&context=uah-dissertations
[5] Baldrige scoring (ADLI/LeTCI, 0–1000 bands, 17 items, examiner feedback report) — Umbrex; ClearPoint Strategy. https://umbrex.com/resources/frameworks/organization-frameworks/malcolm-baldrige-performance-excellence-framework/
[6] EOS Organizational Checkup — 20 questions across Six Key Components; vendor-reported 760,000+ assessments / 22,500+ companies. https://organizationalcheckup.com/
[7] EOS Organizational Checkup administration — 1–5 (and 1–10) scoring, percentage score, multi-rater, retake every 3–6 months (EOS One Help Center; GCE Strategic Consulting; Icelaven). https://help.eosone.com/hc/en-us/articles/44677201213587-Organizational-Checkup-Overview-and-How-to-Use-It
[8] The Value Builder Score — eight value drivers, 0–100 score, owner dataset (tens of thousands), 80+ associated with ~71% higher offers; John Warrillow (“Built to Sell”). https://valuebuildersystem.com/eight-drivers
[9] TCC Group Core Capacity Assessment Tool (CCAT) — 146 items, four core capacities + culture, statistically validated, 9,000+ nonprofits, national benchmark database, multi-rater, certified-facilitator interpretation, lifecycle stage. https://www.tccgrp.com/resource/ccat/
[10] ISO 18091:2019 — Guidelines for the application of ISO 9001 in local government; Annex A self-diagnostic maturity methodology; SDG-aligned (ISO). https://www.iso.org/standard/72808.html
[11] Behaviorally Anchored Rating Scales — Smith & Kendall (1963); reviews finding reduced halo/leniency vs Likert (“sometimes, not always”) and improved inter-rater agreement; development-cost tradeoff (Jacobs, Kafry & Zedeck 1980; Bernardin; PMC review). https://pmc.ncbi.nlm.nih.gov/articles/PMC9598132/
[12] Maturity-model critique — Pöppelbuß & Röglinger (2011); limitations of questionnaire-based maturity models: construct completeness, subjectivity, single-respondent bias. https://www.researchgate.net/publication/262362266_The_maturity_of_maturity_model_research_A_systematic_mapping_study
[13] Common method bias — sources including low-engagement/uniform responding and acquiescence; self-report inflation (Podsakoff et al.; ScienceDirect review). https://www.sciencedirect.com/science/article/abs/pii/S0261517721000492
[14] Wording effects of negatively worded / reverse-coded items on scale validity and reliability (constrained factor mixture analysis study, PMC). https://www.ncbi.nlm.nih.gov/pmc/articles/PMC8417066/
Over50Pros · Strategic Operations Advisory · Delivering a Growth path Without a High-Priced Consultant · Version 1.0, June 2026